Note: There is some confusion about when to watch, and it’s my fault for not explaining it well enough. Regardless of where you are, you should be outside basically as soon as it gets fairly dark, and watch until Jupiter and Saturn set. There is an instant of absolute closest approach between Jupiter and Saturn, but it matters so little I haven’t even bothered to look it up; for all I know it’s 3 AM my time and I won’t be able to see it. The important thing is for you to see Jupiter and Saturn before they set, and that will be at about the same time, local, anywhere, less than 2 hours after sunset.
(The reason I harped on 5 PM my time, which is conveniently the right time for me to start looking, is that the data I got from NASA is for that exact time (midnight UTC).)
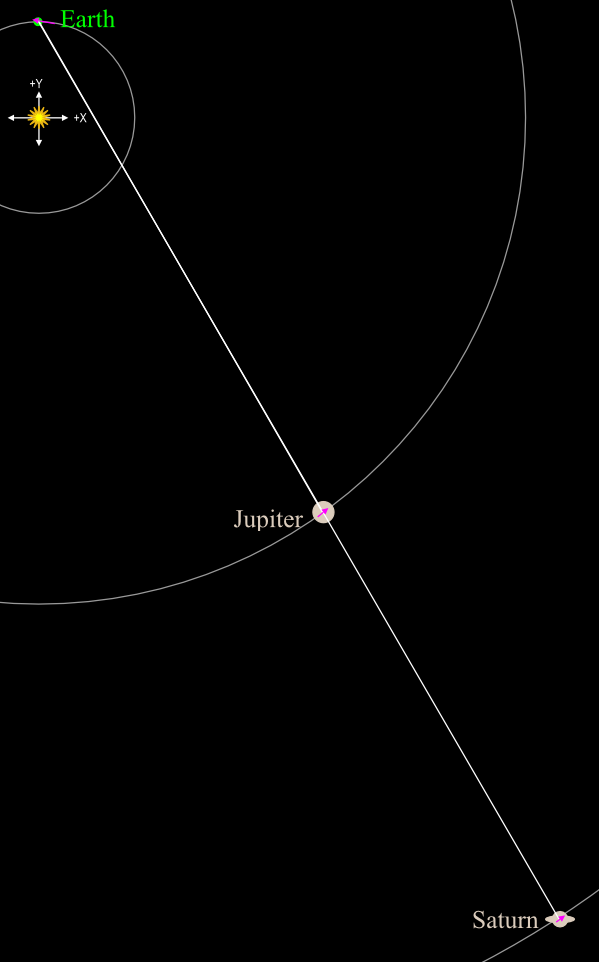
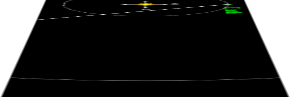
You might remember this diagram from last week (The Great Conjunction I). It’s a diagram of our solar system on Monday, at 5 PM Mountain Time, minus Mars, Venus, Mercury, and everything past Saturn, showing an apparent lineup of Jupiter and Saturn as seen from Earth.

In three dimensions (3D) the lineup is pretty good too, both Jupiter and Saturn are in fact slightly "inside" your monitor and they will be one fifth of the full moon’s width apart in the sky, or one tenth of a degree of arc.
Astronomers like to denote distances “up there” as seen from Earth as angles, because that way it doesn’t matter how far away something is. It’s easiest to measure those angles—that’s what we can directly observe. Distances are harder, sometimes much harder. I gave a link last time to the story of how the distance between the Earth and Sun were first measured using a Venus transit in the 1700s. Since we knew the ratios of the planets’ distances from the Sun, expressing everything in AUs (astronomical units, where 1AU is the mean distance from the Earth to the Sun), that gave us the size of each planet’s orbit by simple multiplication. We could then use the “absolute” number giving the size of Earth’s orbit to measure the distance to the nearer stars, but that was extremely finicky measuring and didn’t get done until the mid 1800s. It’s as if measuring distances is a ladder; each method gives us results we can carry forward to measure the distances to things further and further away. (Of course doing this causes measurement errors to pile up, but they’re still far better than complete guesswork.)
Astronomers still use AUs routinely for talking about the sorts of distances you’d see within a star’s planetary system—even other stars’ planetary systems—because otherwise they’d be tossing around numbers with eight or nine zeros at the end of them.
OK, so, why is Earth at the top of the diagram? Was that some arbitrary choice I made?
Well, it’s arbitrary, but it’s not my choice. And it is handy having the diagram be taller than it is wide; if it hadn’t turned out that way when I plotted it from real position data, I’d have rotated the diagram.
The data from NASA, and therefore the diagram, are expressed in something called “Heliocentric Ecliptic Coordinates.” There are X, Y, and Z values for Earth, Jupiter, and Saturn, and I just plotted them. (It also gives velocity components in the X, Y, and Z directions.) This is a 3D version of the “Cartesian” coordinates that, if/when you had algebra, was what you used to graph functions. Instead of squares on graph paper, imagine cubes.
The center of this big three-dimensional grid is the center of gravity of the Solar System (practically dead center in the Sun). But which way do the axes point? A choice had to be made. It didn’t cosmically matter which way we pointed the axes, but astronomers had to come up with a common convention. What’s fairly obvious and convenient is that the XY plane (where Z is zero) should be the plane of Earth’s orbit about the Sun, and the Z-axis should probably run through the center of the sun with the positive end going out the Sun’s north pole (or close to it, just so it’s at a right angle to the XY plane). Those decisions come from the physical characteristics of Earth’s orbit around the Sun. But we still haven’t defined which way the X and Y axes point, even if we know what plane they are in.
So here comes the arbitrary decision, made sometime centuries ago: The X-axis runs in the direction in which, we on Earth, see the Sun to be at the exact moment of the March equinox (which is “spring” for most people). So we are sighting through the Sun to establish the X-axis.
This means that at that moment, Earth is at roughly X=-1.0 AU, the Sun of course is at X=0.0 AU, and it is Earth’s position at the beginning of (northern hemisphere) fall that is at X=+1.0 AU.
If you look at my diagram, at 3 o’clock on the diagram, on the circle of Earth’s orbit, is where Earth is on the first day of autumn—straight to the right of the “origin” which is where x=1.0 ought to be on any self-respecting graph. At 12 o’clock is the winter solstice (+Y-axis), at 9 o’clock is the spring equinox (-X), and at 6 o’clock is the summer solstice (-Y). You’ll notice I went around the “clock” counterclockwise. That’s because almost everything in our solar system runs counterclockwise. The planets rotate counterclockwise, all of the major moons and planets orbit counterclockwise, and so on, of course this is all as seen from over the north pole of the Sun, our viewpoint being somewhere along the +Z-axis.
Here’s the same diagram with the X and Y axes superimposed.
By the way, how did we decide which direction would be “clockwise”? We did pick a direction, we could have picked the other direction for clocks to run in. Why didn’t we? Well this time there is a reason. In Europe, the shadow on a sundial moves in that direction. If our civilization had started in the southern hemisphere, long odds are that we’d draw our maps with south at the top, our globes would be mounted with south at the top, and our clocks would run counterclockwise. And the people in the northern hemisphere would have to endure all those jokes about being upside down.
Returning to our coordinate system, the Y-axis goes through the spot where the Earth is at (northern hemisphere) winter solstice. Which is pretty much where we will be this Monday. That’s why Earth is straight “up” from the Sun in my diagram.
Which way is Z? It’s straight up out of your screen, right at you. So when I said Jupiter and Saturn were slightly inside your screen, it’s because they have very small negative Z values.
One way to draw directions into and out of the monitor, or a blackboard, which is how I learned it many, many years ago, is to use ⨯ for into the monitor and ⋅ or even ⊙ for out of it. This is meant to suggest an arrow with four tail feathers and a conical head, the dot is the point of the arrow (facing you, out from the monitor or chalkboard)—circled just shows you the entire arrowhead looking at you straight on. The ⨯ suggests the four tail feathers when the arrow is pointing into the monitor (or chalkboard).
One more thing about coordinate systems (if you haven’t gotten bored yet), the issue of “right-handed” versus “left-handed.” If you use your right hand to point, like a kid making a gun with his fingers, along the X-axis, your other fingers bend towards the Y-axis, and your thumb points along the Z-axis, it’s a right-handed system. If you can’t get this to work with some coordinate system, try your left hand. If that works, you are using a left-handed system.
These ecliptic coordinates I got from NASA are right-handed.
And it’s cool that this diagram just happened to lay out well without having to be rotated. Those of you who remember your algebra and “graphing things” should find a lot of this familiar.
OK that’s enough of that rather abstract stuff. Now I’m going to try to explain why all of “great conjunctioning” is happening in the southwestern sky after sunset.
First, imagine yourself somewhere on the line between sun and Earth, and you are facing towards the earth, with the Sun shining on your back.

Or, imagine my first diagram tilting away from you as shown, and you being transported to the big white X in the upper left. Then continue tilting until you are edge-on.
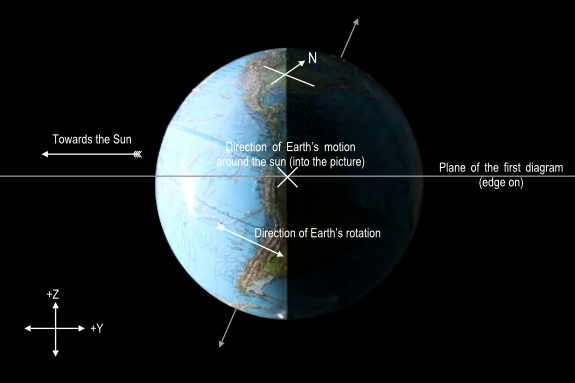
What do you see? Well, because it’s the winter Solstice, this is what you see.
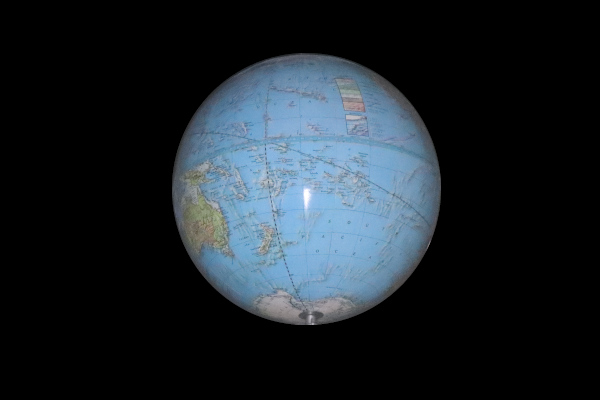
Globe simulating Earth seen from the sun at December Solstice
Well, OK you won’t see all the labels and so forth, and especially not the big metal thing on the south pole, but the thing to notice is that the south pole is visible and the north pole is not. The earth’s axis is tilted with respect to the ecliptic (the plane we’re standing on in our little mind-experiment). It stays pointing in the same direction (almost–it moves slowly, so slowly you’ll never notice). So as it moves around its orbit, from right to left in this diagram, there are times when the north pole points away from the sun (and us) and times when it points towards the sun. This coming Monday just happens to be the day when the north pole is pointed as much away from the sun as it ever is (that’s the definition of the December solstice).
In the upper right, not very visible, is North America. The earth rotates west to east, so North America is about to go onto the far side, the dark side–it’s late in the day there. Here are some annotations and a set of axes in the lower left. Notice Z is now up, because +Y points into the picture.

Now here’s a side view. Going back to the original diagram, it’s as if we tilted it this way, instead.
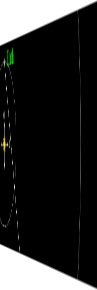
But if we’re going to imagine ourselves standing on the diagram, we need to make it horizontal, like this:
So, finally, here’s a “side” view of Earth from the right.

“Side” view.
From this vantage point, the Earth is moving directly away from us in its orbit. On the first diagram, we’re somewhere to the right of Earth, looking toward it.
Any horizontal line on this last picture, points at the Sun. And if you can imagine some Deplorable in flyover country standing in Kansas, looking at the setting Sun… well, it’s not to the west. It’s south of west. Because west is actually to the left and up in the diagram, not straight to the left, as shown below. And north is kind of tilted askew because the ground that deplorable is standing on is actually tilted away from us (imagine standing where the compass rose is).
This is why the Sun is setting to the south of west at this time of year (someone asked me about that a few days ago, I hope she’s reading this).
But what about Jupiter and Saturn? Well, let’s back up a bit. Here’s the diagram “tilting” again. Notice the diagonal dashed line (I don’t know why but my graphics software turned it into a dashed line); that’s the line to Jupiter and Saturn.
So, imagine it tilting all the way… and that diagonal line becomes a line running left from Earth to Jupiter and Saturn, but it also slopes up and out of the screen!
The horizon plane for our sunset-viewing Deplorable was tilted, some, away from us, but the Sun is on that plane because it’s sunset. Jupiter and Saturn are above that plane, also in the southwest, at sunset.
Which, for our Deplorable in Kansas who’s watching the sunset, means they’re still up above the horizon.
If I have been doing my job as a writer, you’ve been following me and understand this, and you can see how in three dimensions it all hangs together now. I wouldn’t be surprised, though, if many here are still confused. It’s tough to do this sort of thing even with diagrams.
But at least now you should know where to look on Monday evening!
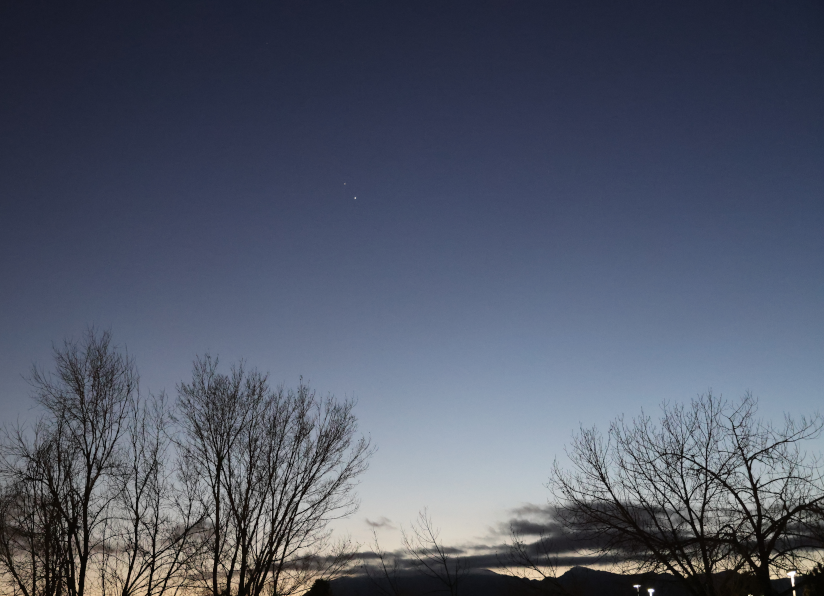
And just to put the icing on the cake, here’s a photo I took just as it was getting dark on Wednesday, facing in the general direction of sunset. The two visible “dots” in the sky are Jupiter (brighter one) and Saturn (dimmer one, above and left of Jupiter). Even after it’s dark they will be noticeably brighter than any star, particularly in that part of the sky.